Nutrient Balance Index

Since I have been dwelling so much on nitrogen this year I thought it would be a good idea to re-affirm the importance of nutrient balance! This year we added a new parameter called the nutrient balance index (NBI).

NBI interpretation:
0-50 – Excellent
50-100 – Some imbalance
100-175 – Imbalances are present
175+ – Severe imbalance
Plant tissue testing is an under-utilized tool that can tell us a great deal about the nutrients available to the crop. We use soil testing to measure the nutrients we think will be available to the plant, but a host of factors (not only chemical, but also physical, biological and environmental) contribute what is actually available to the plant.
With crops in the reproductive stages it is an excellent time to “ask the plant how it feels” about the growing conditions.
Sampling Strategies:
Sample Good vs Bad, Light vs Dark, etc – This will allow you to see quantify the differences you see visually
Don’t sample the absolute worst plants – Especially leaves that are dead or damaged. Try to sample leaves that are poor but not the worst.
Corn – Corn at tasseling should be sampled from the ear leaf.
Soybeans – Sample the most recently matured trifoliate.
Take a soil sample – Adding a soil sample from the same spot can help you confirm the results of your tissue test and allows for better understanding of the interaction between your soil and the plant.
More information on tissue analysis is available here:

Soil Nitrate Update – Mid June

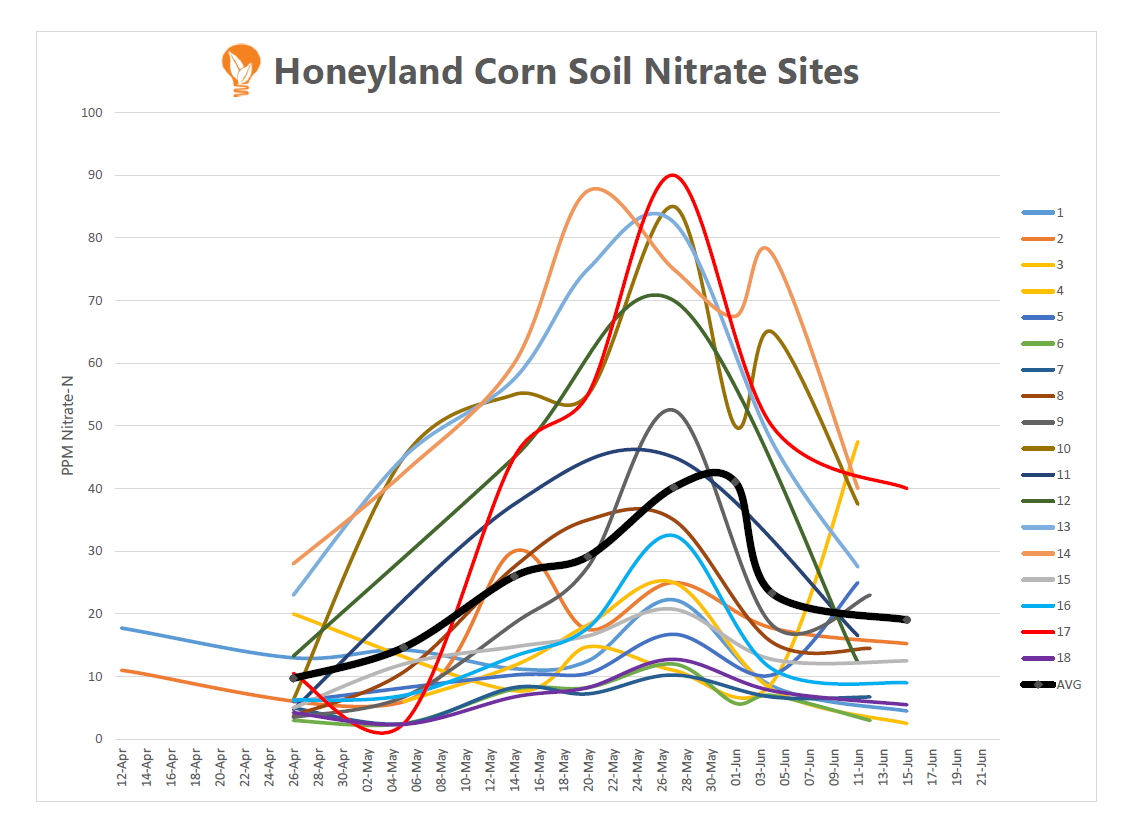
Here’s another update on soil nitrate levels including the latest rain events. It’s funny, if you would have asked a few weeks ago where I thought nitrate levels would be I would have guessed that almost every site would be over 25 ppm. How things have changed!
Soil Nitrate Levels in Ontario

Soil Nitrate Update – May

Soil Nitrate Levels

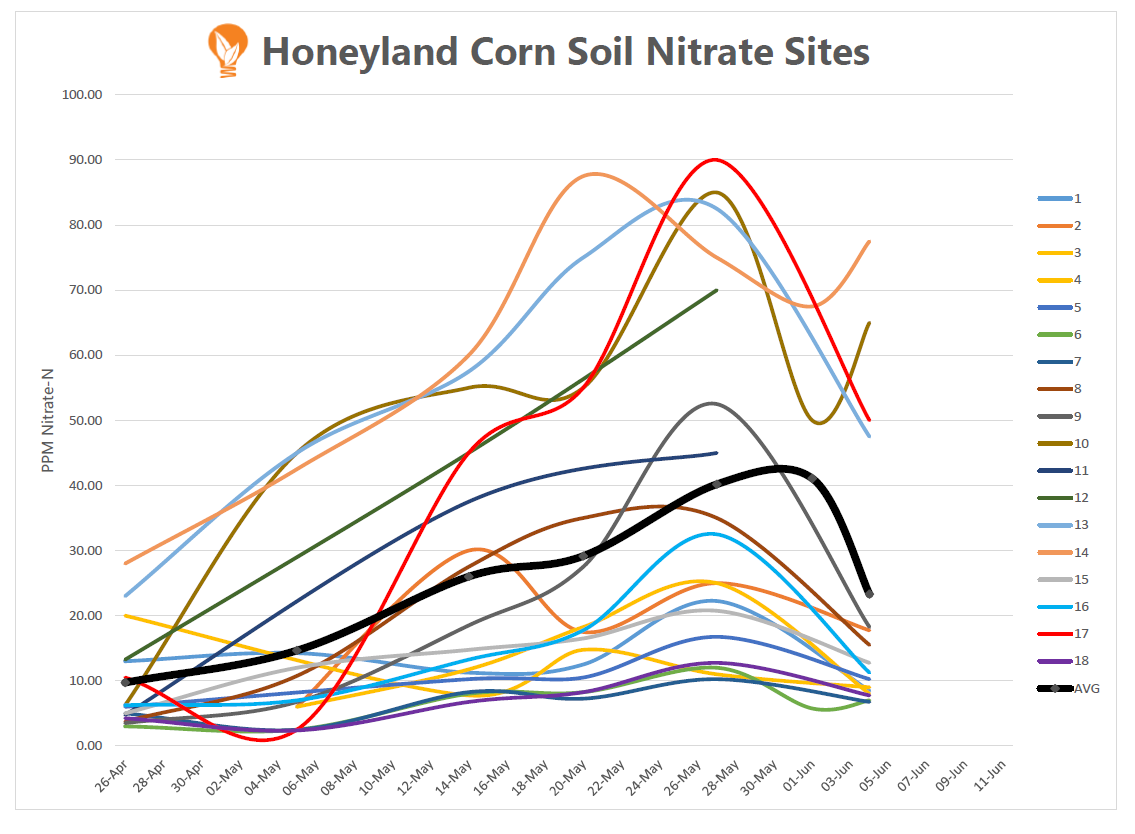
Here is an update on soil nitrate levels. With the rain event (approx 2 inches) on May 30-31st nitrate levels in the top foot dropped. The severity of the drop ranges from 0 to 65% (0-40 ppm) with the average being 41% (15 ppm).  This nitrate is not gone, but has been pushed further into the soil profile. There were a few samples that were taken just after the rain (the fields were still muddy) and it’s interesting to see how the nitrate levels dipped and bounced back a few days later. How far down the nitrate went will depend on factors related to water mobility like soil type, compaction,organic matter, etc. It will be interesting how things look after the latest rain.
15.06.05 Soil Nitrate
Plant Tissue Levels
 
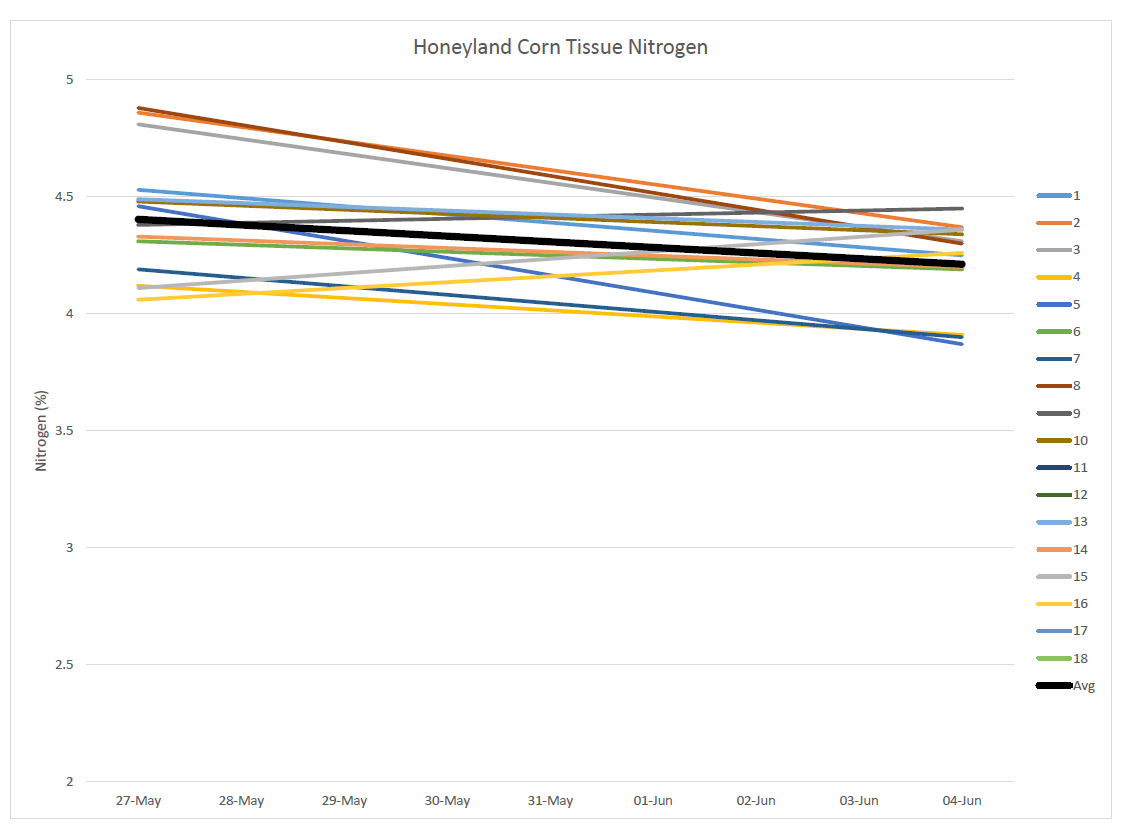
On the plant tissue side of things there is about 20% variance between the nitrogen levels across sites. Compared to last year at this growth stage tissue nitrogen appears to be lower.
15.06.05 Plant Tissue Nitrogen
If you are interested in seeing how corn changes as it grows, last year’s tissue composition information (Protein, Sugar, Fibre & Mineral Content) is available at https://www.honeylandag.com/agronomy/corn-plant-tissue-composition-at-different-growth-stages/ This information is available on our corn plant tissue tests this year.