Plant Tissue Update – Mid June

There has been lots of variability in the nitrogen levels with some sites plummeting and some increasing in plant N. The range of values last week was from 4.5 – 3.25% nitrogen. Our observation is that sites that had an increase were the hardest hit by frost.
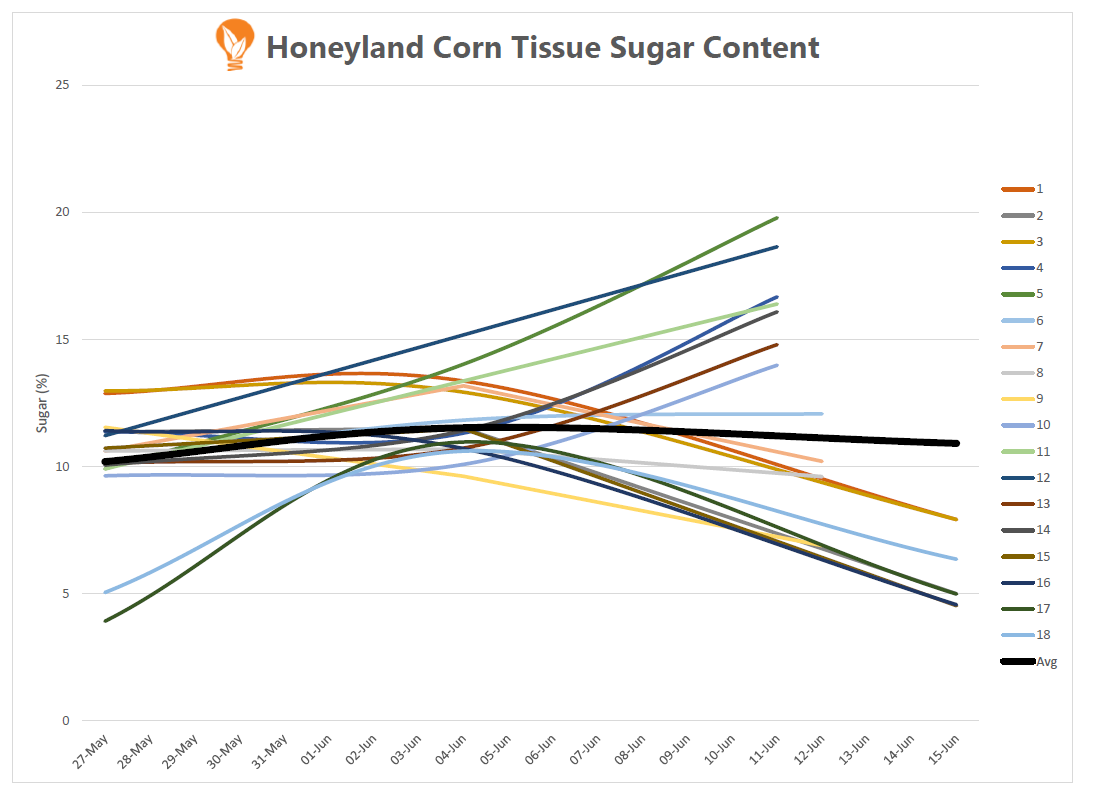
On some of the plants with lower N values we noticed that it corresponds to the accumulation of mobile carbohydrates (sugars) in the leaves. One thing I found interesting is the drop in sugar levels from June 11th to June 15th (see chart below).
For the 2015 growing season we are providing sugar analysis on our corn tissue test free of charge! Learn more here:
On the growth stage side most corn in the GPA (Greater Parkhill Area) is at or past V6. Some here are some info on what is happening in corn at V6:
-Growing point and tassel (differentiated in V5) are above the soil surface
-Stalk is beginning a period of rapid elongation
-Determination of kernel rows per ear begins (Strongly influenced by hybrid genetics)
-Tillers (suckers) begin to emerge at this time
-Degeneration and loss of lower leaves
-New leaf emerging (V-stage) about every 3 days

Corn Sugar Levels Ontario

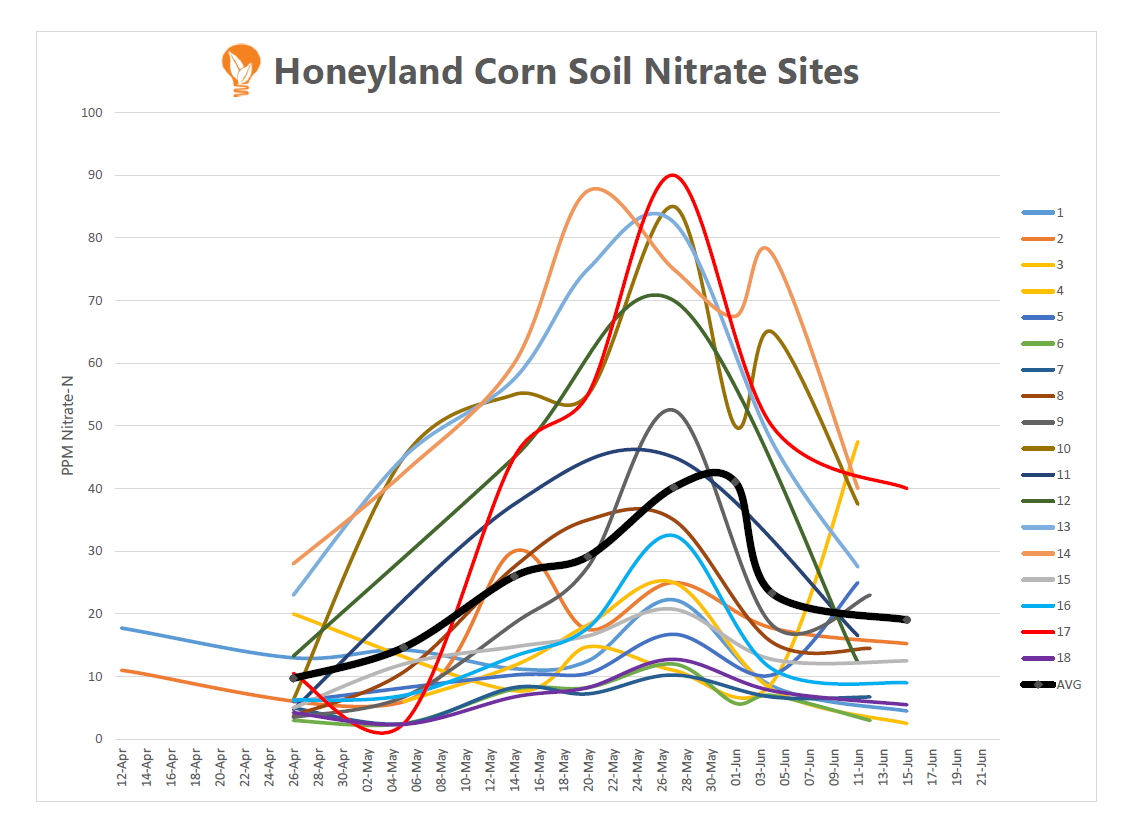
Soil Nitrate Update – Mid June

Here’s another update on soil nitrate levels including the latest rain events. It’s funny, if you would have asked a few weeks ago where I thought nitrate levels would be I would have guessed that almost every site would be over 25 ppm. How things have changed!
Soil Nitrate Levels in Ontario

Soil Nitrate Update – May

Soil Nitrate Levels

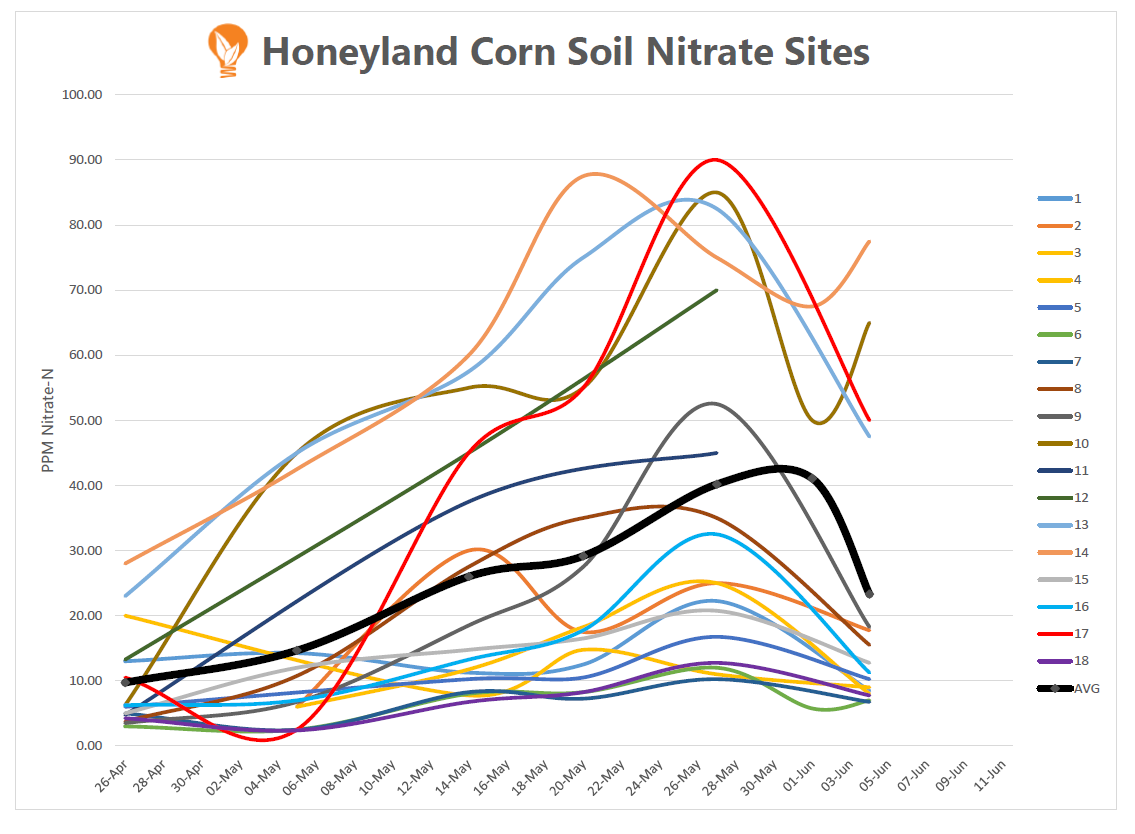
Here is an update on soil nitrate levels. With the rain event (approx 2 inches) on May 30-31st nitrate levels in the top foot dropped. The severity of the drop ranges from 0 to 65% (0-40 ppm) with the average being 41% (15 ppm).  This nitrate is not gone, but has been pushed further into the soil profile. There were a few samples that were taken just after the rain (the fields were still muddy) and it’s interesting to see how the nitrate levels dipped and bounced back a few days later. How far down the nitrate went will depend on factors related to water mobility like soil type, compaction,organic matter, etc. It will be interesting how things look after the latest rain.
15.06.05 Soil Nitrate
Plant Tissue Levels
 
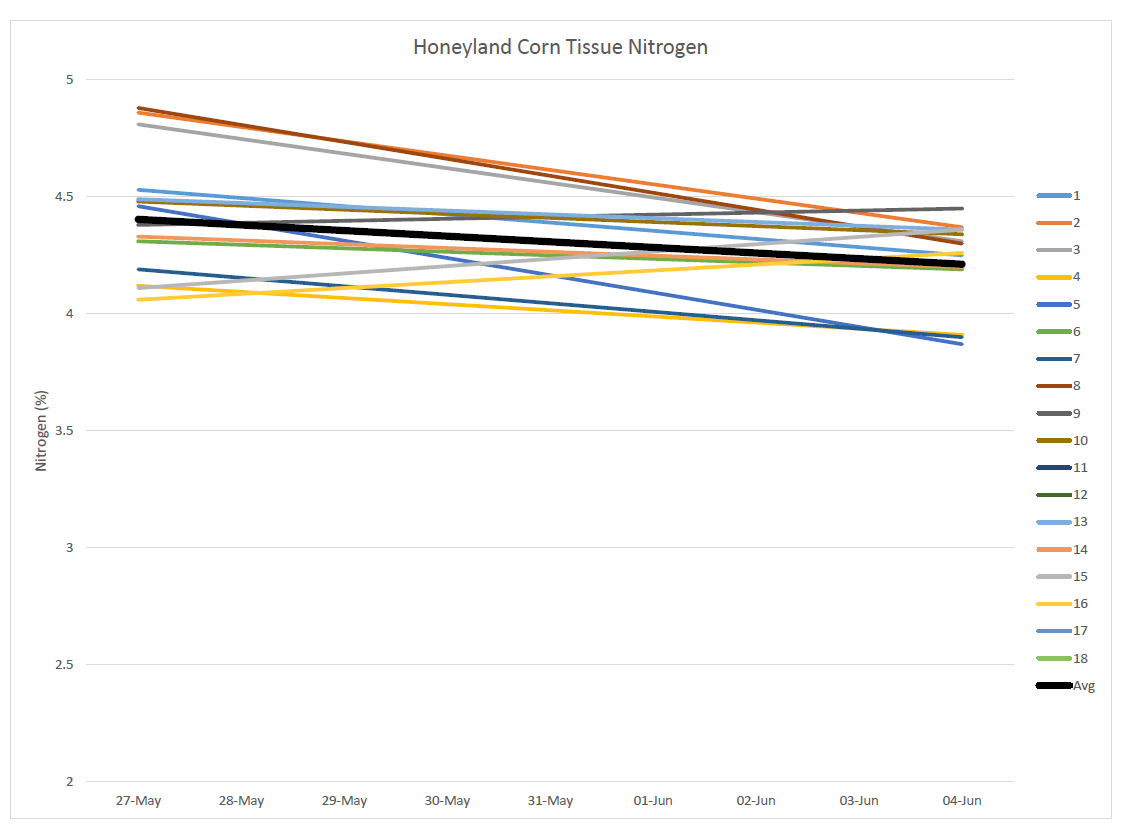
On the plant tissue side of things there is about 20% variance between the nitrogen levels across sites. Compared to last year at this growth stage tissue nitrogen appears to be lower.
15.06.05 Plant Tissue Nitrogen
If you are interested in seeing how corn changes as it grows, last year’s tissue composition information (Protein, Sugar, Fibre & Mineral Content) is available at https://www.honeylandag.com/agronomy/corn-plant-tissue-composition-at-different-growth-stages/ This information is available on our corn plant tissue tests this year.